TELEMETRY DASHBOARD FOR SCANIA G & R & T V0.8
Description:
INSTALLATION:
• Extract the contents of the RAR archive. LEAVE THE “SCANIA G-R-T” FOLDER INTACT.
• Move the “Scania G-R-T” Folder to the Skins folder of the Telemetry Server (located at *SERVER-ROOT-FOLDER*Htmlskins)
• Go bonkers! BUT NOT BEFORE AT LEAST BRIEFING THROUGH THE REST OF THE README.
BRIEF DOCUMENTATION:
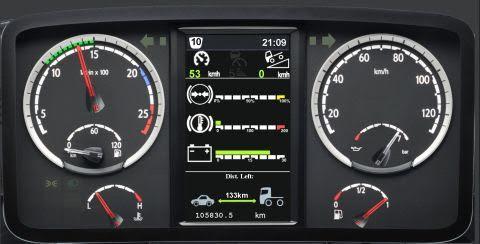
The dashboard computer has 3 information displays that stay exactly where they are, as long as the truck’s battery is running:
• At the very top of the dashboard computer, on the left is displayed the gear currently selected, and on the right is the game time in format HH:MM. If and when you engage the Engine Brake, the corresponding Engine Brake icon will appear just to the left of the time display, and vice versa.
• Just below the Gear&Time row, there is the Speeds Information display:
– on the very left is the actual truck speed (km/h)
– to its right is the Cruise Control Downhill Tolerance range (fixed at 5km/h due to the Telemetry’s incapability of reading the Cruise Control Step Grid from the game; however, it WILL light up as soon as Cruise Control is engaged)
– on the right-hand side of the Speeds Info display, is the Cruise Control setting currently selected in the simulator (fully operable).
• At the bottom sector of the dashboard display:
– In the upper part of the bottom sector, there is the estimated distance from the truck’s current position to the GPS destination (in kilometers).
– Above the truck symbol, the mass of the trailer currently attached to the truck is displayed (if there is one).
– In the bottom part of the bottom sector, is the Odometer – displays the distance driven with the particular truck selected in the simulator.
The dashboard computer added to this skin has 4 pages of information, displayed in the middle of the dashboard computer screen, between the Speed Info display and the Distance&Odometer. IN ORDER TO CYCLE BETWEEN THE PAGES, SIMPLY CLICK ANYWHERE ON THE DASHBOARD COMPUTER. Below are listed the pages, with a short description of the data found in each one of them, from the highest to the lowest:
• Page I – Fuel Page: at the top of the the page, there is the current amount of fuel loaded into the truck, in litres. Right below it is a bar displaying how much of the fuel tank is loaded (visual fraction). Below that bar, is the Average Fuel Consumption (in Litres per 100km) in green, below which there is the estimated distance the fuel will be enough for (don’t confuse with the Distance-to-Destination right below it), in green as well.
• Page II – Air Pressure Page: all three bars read the same measurement – Air Pressure (in the tank), in PSI (useful only with “Air Brakes Simulation” enabled in the game); the game does not distinguish between different Air Pressures in the different air tanks.
• Page III – Diagnostics Page: the number at the top (in white) denotes the current Water Temperature (in Celsius degrees), and right below it is a bar displaying the same datum. Below those two is the Oil Temperature (in Celsius degrees), and the Oil Temperature in a bar-format display.
• Page IV – Truck Statistics Page: the top bar displays the current brake pedal pressure (how hard it’s pressed down, which gives a pretty good idea about the Brake Pad pressure, although no such datum is available through the Telemetry SDK); quite visually-self-explanatory. The bar in the middle displays the Brake Temperature in Celsius degrees. The bottom one displays the truck’s Battery Voltage, in Volts.
Authors:
Nazgûl
Telemetry_Dashboard_for_Scania_G___R___T.zip – 1.7 MB uploadfiles.eu/sharemods.com
1 Response
Leave a Reply
NEXT NEW


the speed gauge has no moving needle ! what can i do to fix it !